Tuna-9 · TU Delft / QuTech / Quantum Inspire
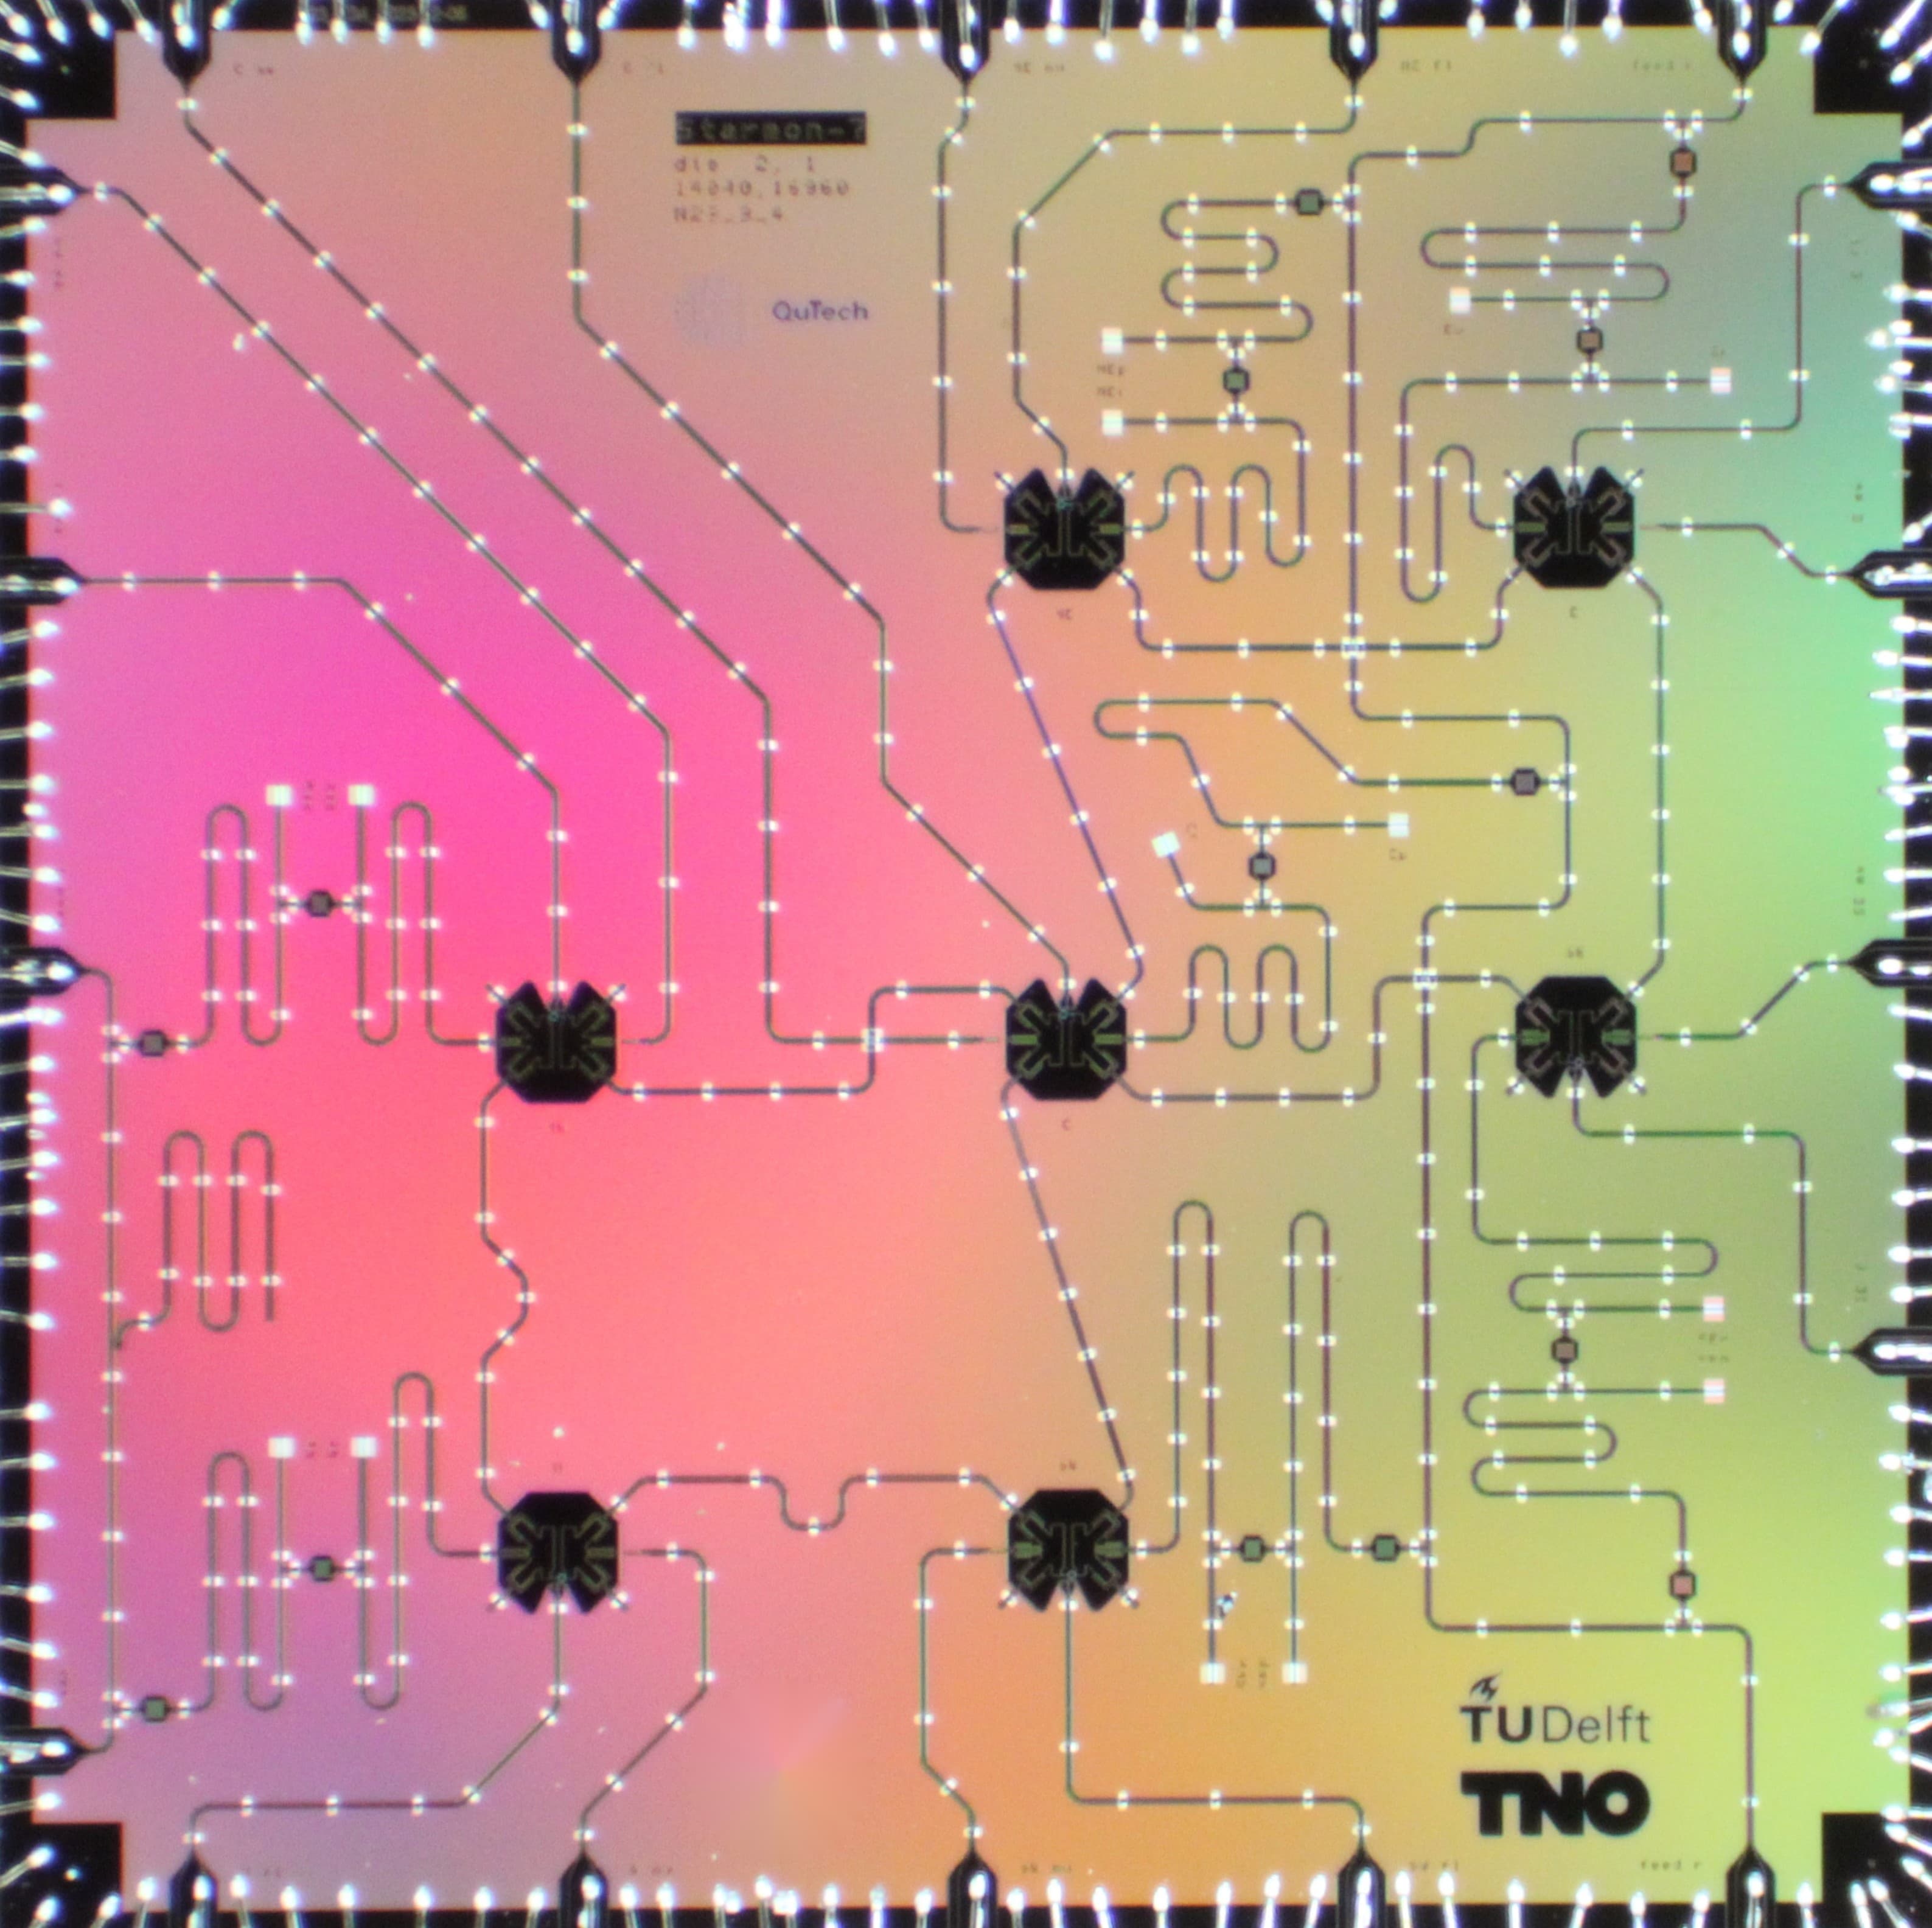
Starmon chip · transmon qubits visible as cross shapes
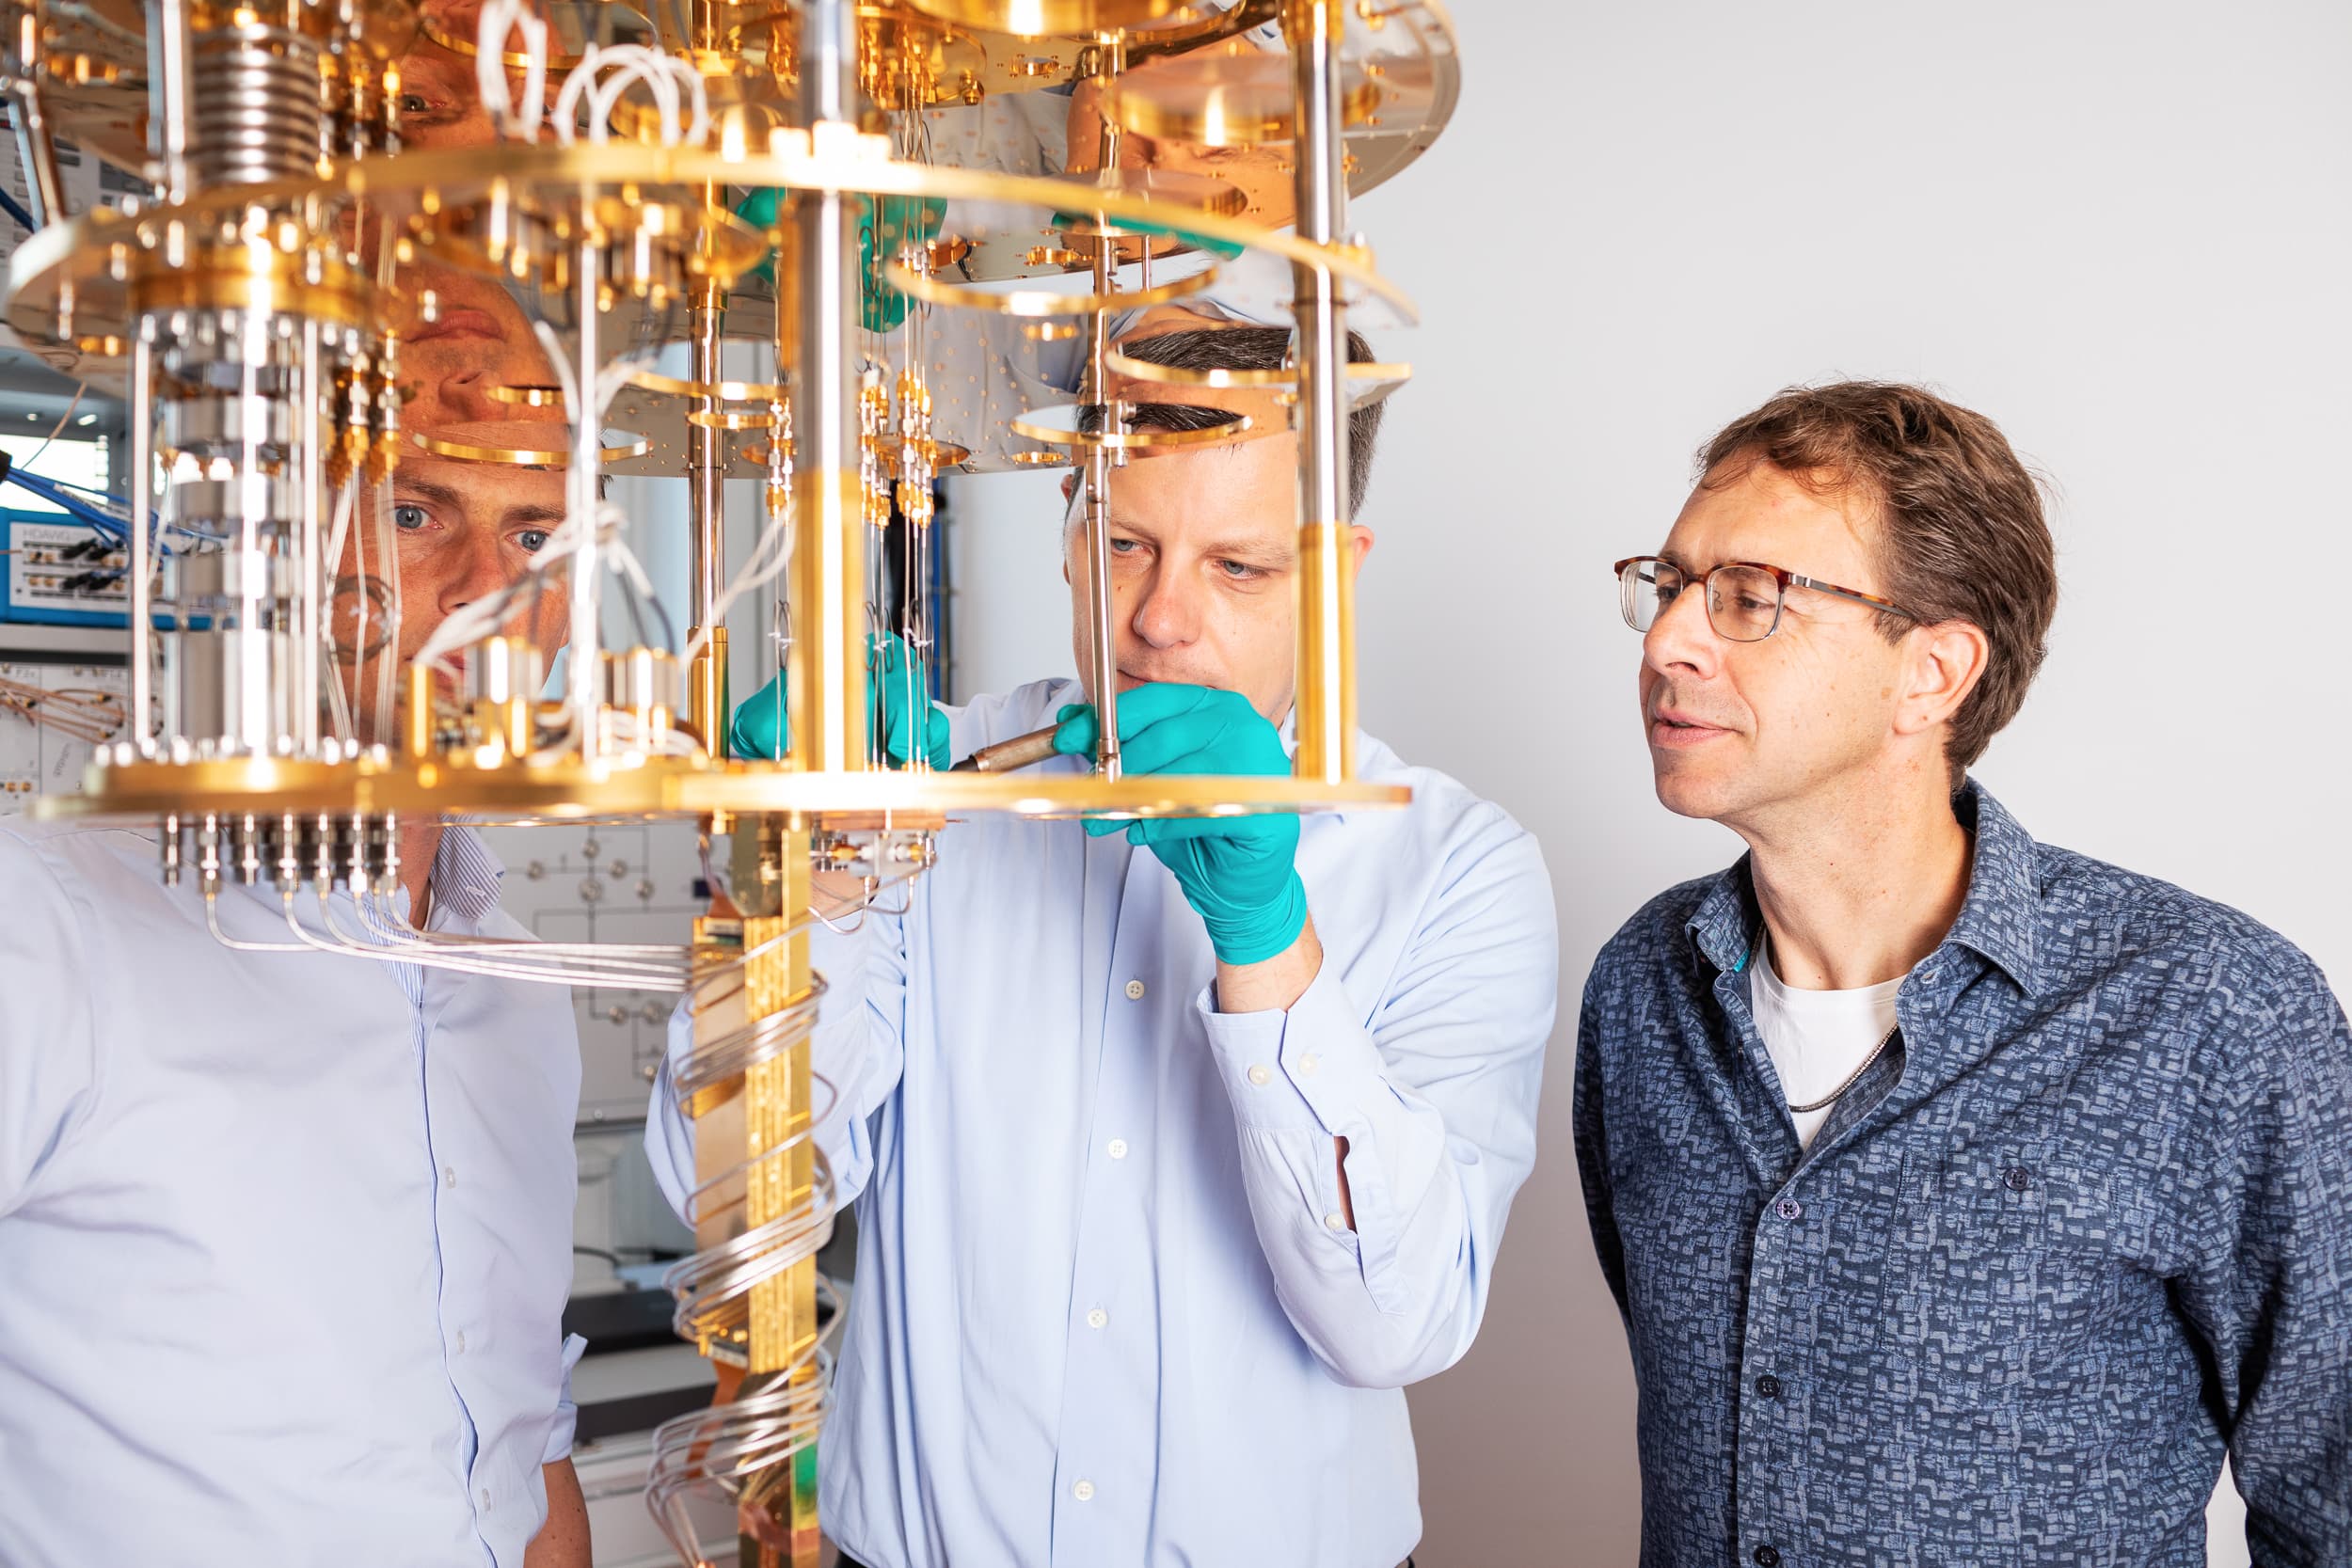
Dilution refrigerator · cools the chip to 15 mK
Photos: QuTech / TU Delft. Chip photo: Marieke de Lorijn.
Meeting a Quantum Computer
Tuna-9 is a 9-qubit superconducting processor in a refrigerator in Delft. These seven acts translate what it does into sound and visuals you can experience.
Microwave frequencies (5 GHz) are mapped to audible tones (300–600 Hz). All measurements are from real hardware experiments. Where choices are artistic, we say so.
Best with headphones. Scroll down to explore each act.
The Chip
9 qubits on sapphire
Tuna-9 is a superconducting quantum processor at TU Delft. It has 9 transmon qubits — tiny circuits made of tantalum on a sapphire surface, cooled to 15 millikelvin (colder than outer space). Each qubit vibrates at its own microwave frequency, around 5 GHz — that’s 5 billion cycles per second. The lines between them are tunable couplers that let neighboring qubits interact.
What you hear
Nine tones enter one by one, each at the audible equivalent of that qubit’s resonance frequency (5.15–5.46 GHz mapped to 375–530 Hz). They’re panned across stereo: q0 at left, q8 at right. Together they form a dense chord — the tight cluster reflects how close real transmon frequencies are.
Data source
Frequencies from published DiCarlo lab devices (arxiv 2503.13225). 12-edge topology from QI API. Bell fidelities measured on all 12 pairs, Feb 2026.
Not All Equal
Each qubit has a personality
These 9 qubits are not identical. Each has a different error rate — how often it gives a wrong answer. Qubit 2 gets it right 98.4% of the time. Qubit 0 fails 12.3% of the time — nearly 8x worse. This heterogeneity is a fundamental reality of today’s quantum hardware. Choosing which qubits to use for a computation matters enormously.
What you hear
All nine qubit tones play simultaneously, but with different qualities. Clean qubits (q2, q5) sound as pure sine tones. Noisy qubits (q0) have audible roughness — noise mixed in proportional to their measured error rate. The contrast between a "clean" and "noisy" qubit is immediately audible.
Data source
Error rates are from single-qubit X gate + measurement experiments on Tuna-9 (1024 shots per qubit). The roughness is calibrated to real error rates but the sound texture is an artistic choice.
Talking to a Qubit
Gates as microwave pulses
To control a qubit, you send it a precisely shaped microwave pulse at its resonance frequency. An X gate flips the qubit from |0⟩ to |1⟩ — a π-rotation on the Bloch sphere. The DRAG pulse shape lasts about 20 nanoseconds and is carefully designed to prevent the qubit from accidentally jumping to a third energy level. On Tuna-9, single-qubit gates succeed 99.82% of the time.
What you hear
A pure sine tone (the qubit in |0⟩), then a brief harmonics-rich burst (the gate pulse — sawtooth wave representing the broadband energy of a real microwave drive), then a richer tone with subtle vibrato (the |1⟩ state). Both states are at the same frequency — only the timbre changes. In reality you can’t hear the difference; the timbre shift is an artistic choice.
Data source
Gate fidelity 99.82% from randomized benchmarking on Tuna-9. Pulse duration and DRAG shape from published QuTech device specifications.
The Connection
Entanglement via coupler
The real power of quantum computing comes from connecting qubits. When two qubits become entangled, measuring one instantly determines the other — they share a single quantum state. Starmon’s key innovation: two-qubit CZ gates work by pulsing the tunable coupler between qubits, not the qubits themselves. A 60-nanosecond flux pulse creates the entanglement. The best pair (q4-q6) reaches 93.5% Bell state fidelity.
What you hear
Two qubit tones (q2 and q4) play independently in left and right ears. Then a low thump (the CZ gate pulse on the coupler). After the gate, the tones lock together — eight correlated notes, always matching (high-high or low-low). Then a crack: the entanglement breaks, and the tones become independent again — sometimes matching, sometimes not.
Data source
Bell fidelities from our experiments on Tuna-9. The correlated/uncorrelated pattern demonstrates entanglement vs. classical randomness.
Growing Fragile
Noise accumulates with scale
The more gates you run, the more errors pile up. We ran a 9-qubit Ising model simulation at increasing circuit depths. At depth 1 (5.6% error), all 9 qubits hold their states well. By depth 3, qubits at the chip’s edges start losing coherence. By depth 5 (41.5% error), edge qubits q6-q8 have collapsed to near-random noise. This is the fundamental challenge of quantum computing today: a race against decoherence.
What you hear
Three successive chords, one per circuit depth. In each chord, every qubit’s volume is proportional to its measured Z-expectation (how well it held its state). Depth 1: a full, bright 9-note chord. Depth 3: the chord thins as edge qubits get quieter. Depth 5: only the strongest qubits remain — the chord is sparse and dying.
Data source
All values are real measurements from a kicked Ising simulation on Tuna-9 (4096 shots, Kim et al. 2023 protocol). The volume mapping is linear: Z-expectation = 0.95 maps to near-full volume, 0.025 is barely audible.
Cleaning Up
Error mitigation works
We can’t fix individual quantum errors, but we can statistically cancel them. Zero-noise extrapolation (ZNE) runs the same circuit at different noise levels and extrapolates to the zero-noise answer. On our Ising simulation, ZNE improved the result by 3.1x — from 5.6% error down to 1.8%. The noisy M_z = 0.944 became a mitigated M_z = 0.982, much closer to the ideal 1.0.
What you hear
Two tones slightly detuned from each other, creating an audible beating. The beat frequency represents the error: fast beating = large error (noisy result), slow beating = small error (mitigated result). First you hear the noisy version (rapid pulsing), then a sweeping transition, then the mitigated version (the beating nearly vanishes into a steady tone). The stillness IS the accuracy.
Data source
ZNE results from our Tuna-9 Ising experiment (gate folding factors 1 and 3, linear Richardson extrapolation). Beat frequencies are mapped from error magnitude.
What Tuna-9 Taught Us
A report card from 9 qubits
Tuna-9 is 9 qubits. It’s noisy, it’s small, and it taught us real things about quantum computing. Single gates work 99.82% of the time. Entangled states reach 93.5% fidelity. A 9-qubit Ising simulation matches theory at shallow depth. Error mitigation improves results by 3.1x. Every number on this page came from sending real microwave pulses to real superconducting circuits in a refrigerator in Delft.
What you hear
The full 9-qubit chord one last time, with each qubit’s amplitude scaled by its reliability (1 minus error rate). This is the chip’s honest self-portrait. The chord sustains, then fades exponentially — mimicking T2 decoherence as the quantum state returns to the ground state.
Data source
Amplitudes reflect real per-qubit success rates. The exponential decay time is artistic but inspired by published T2* values (~10-34 µs for similar transmons).
How the sonification works
Frequency mapping
Qubit frequencies (5.0–5.6 GHz) are linearly mapped to 300–600 Hz. The narrow range reflects how closely real transmon frequencies cluster on actual hardware.
Amplitude
Volume encodes real data: Z-expectations from Ising simulations, error rates from qubit characterization, Bell state probabilities from entanglement experiments.
Beat frequencies
When two tones are close in frequency, you hear pulsing at f_beat = |f1 - f2|. We map error magnitude to beat frequency: large error = rapid pulsing, accuracy = stillness.
Implementation
Pure Web Audio API — OscillatorNode, GainNode, StereoPannerNode, BiquadFilterNode, and AudioBufferSourceNode for noise. No samples, no libraries.
What's real vs. artistic
Data-driven
- Qubit frequencies (published device calibrations)
- Per-qubit error rates (measured on Tuna-9)
- Topology & Bell fidelities (our experiments)
- Ising Z-expectations at 3 depths (4096 shots)
- ZNE improvement factor (gate folding + extrapolation)
Artistic choices
- Timbre change for |0⟩ vs |1⟩ (states share one frequency)
- Stereo panning for qubit position
- Noise texture proportional to error rate
- Correlated note sequences for entanglement
- Beat frequency mapping for error magnitude